DevOps Service Monitor
A lightweight, privacy-first tool to monitor your servers and services — entirely on your device.
OpsMon supports four types of monitors. Each runs locally on your device with no backend required.
Track SSL/TLS certificate expiry. Stay ahead before certificates expire.
Check host reachability. Know immediately when a service goes down.
Measure response time. Set your own warning threshold to catch slowdowns early.
Monitor endpoints for non-2xx responses. Follows redirects automatically.
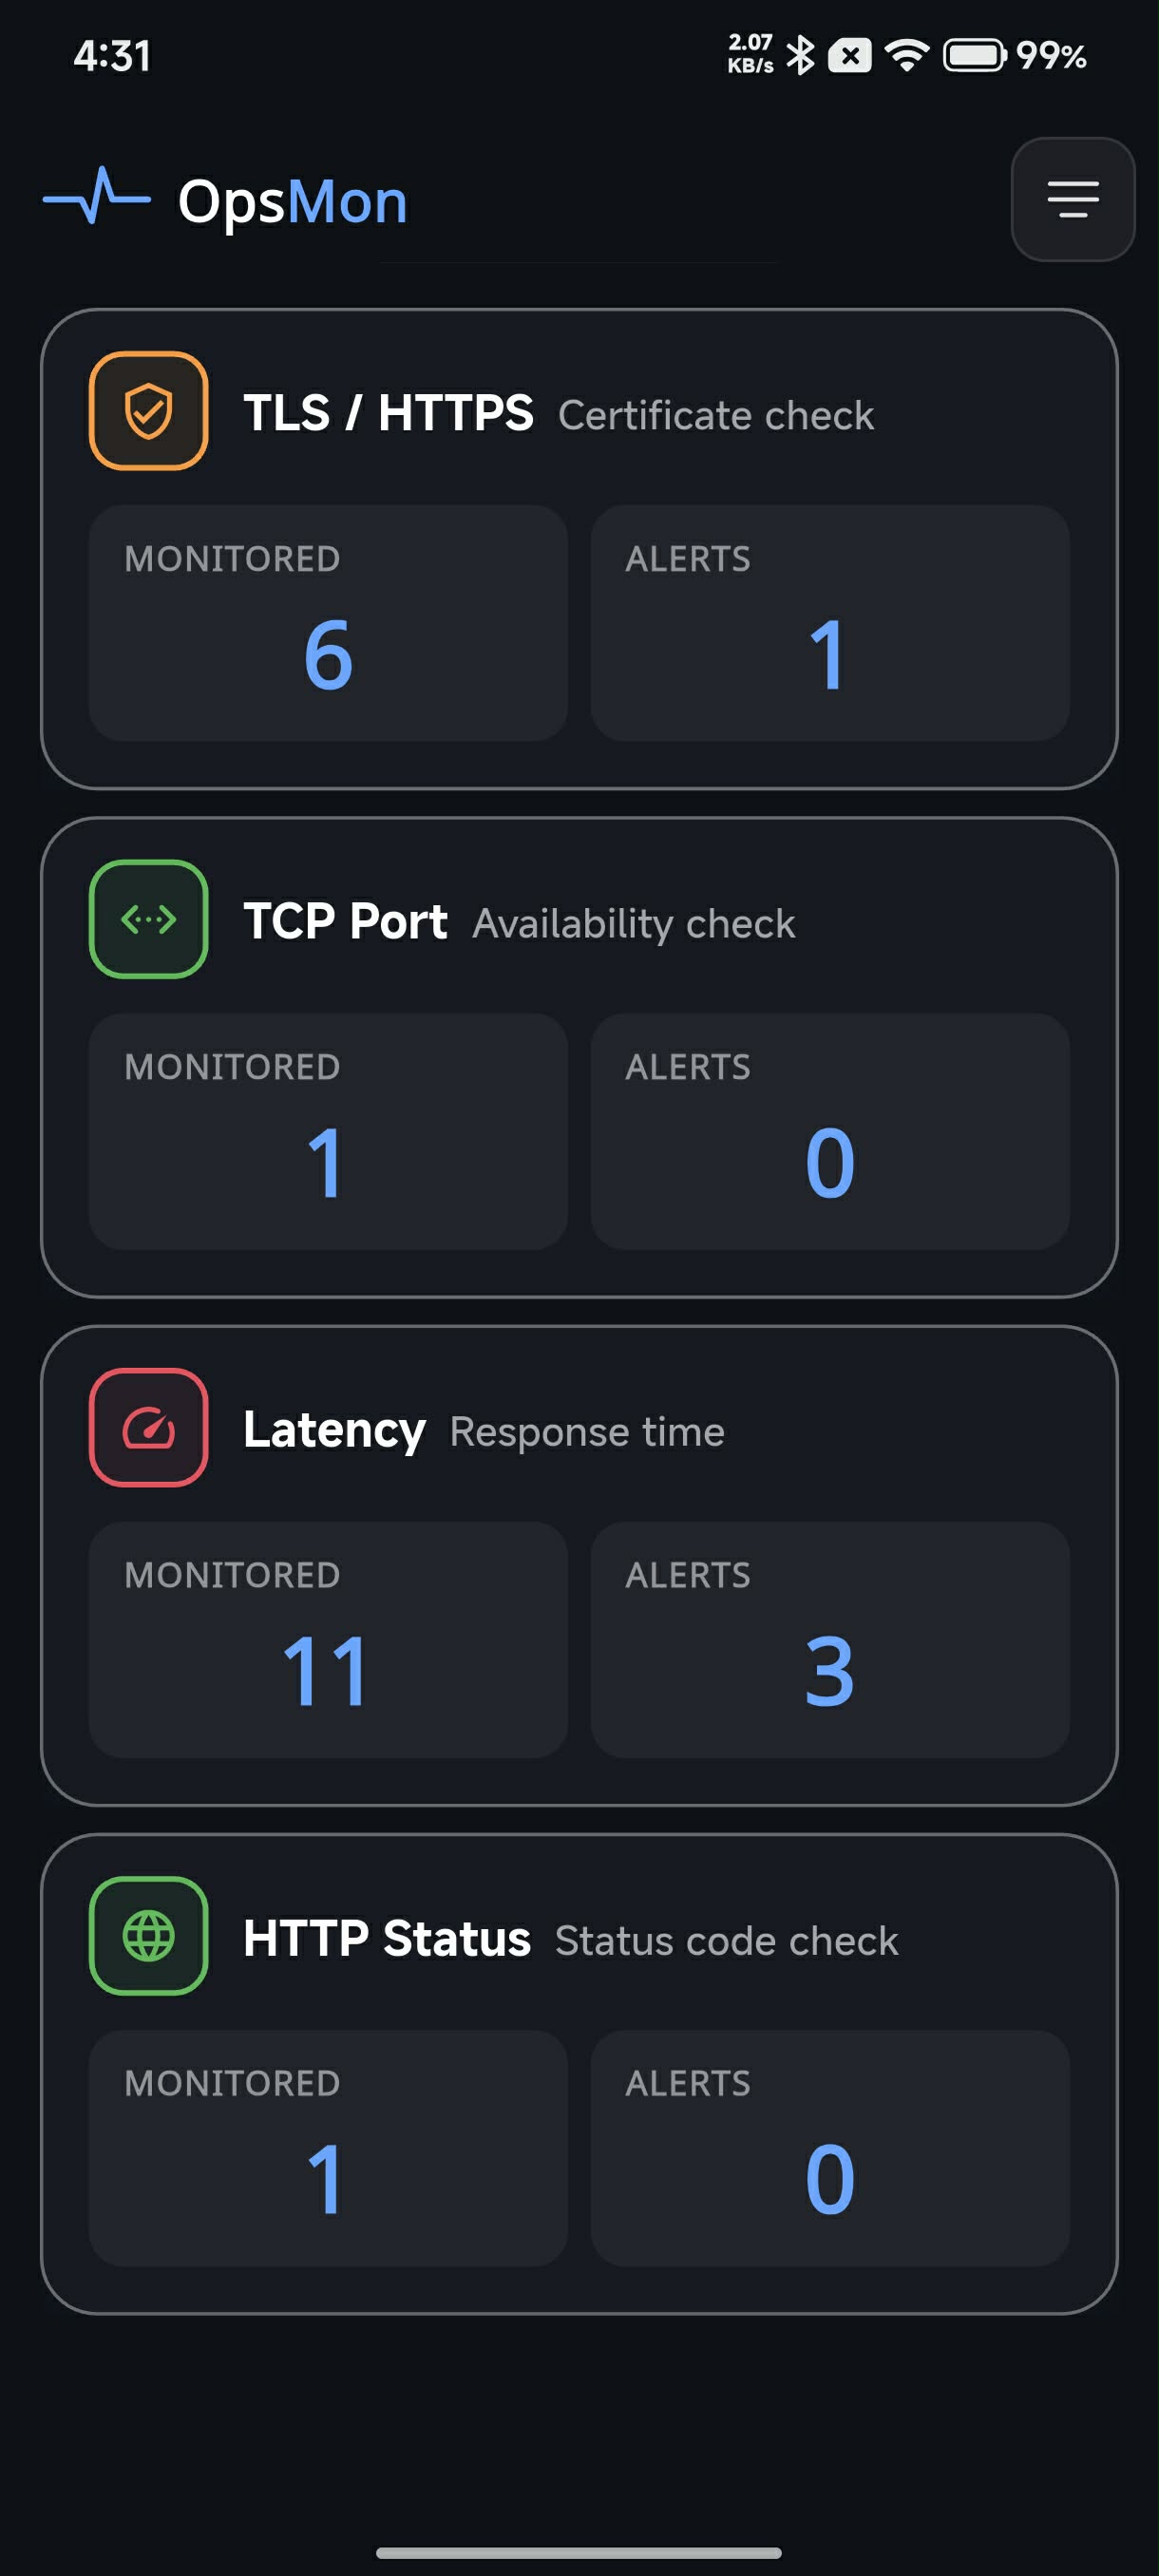
When you open OpsMon, you'll see the main dashboard — a summary of all your monitor types with live counts.
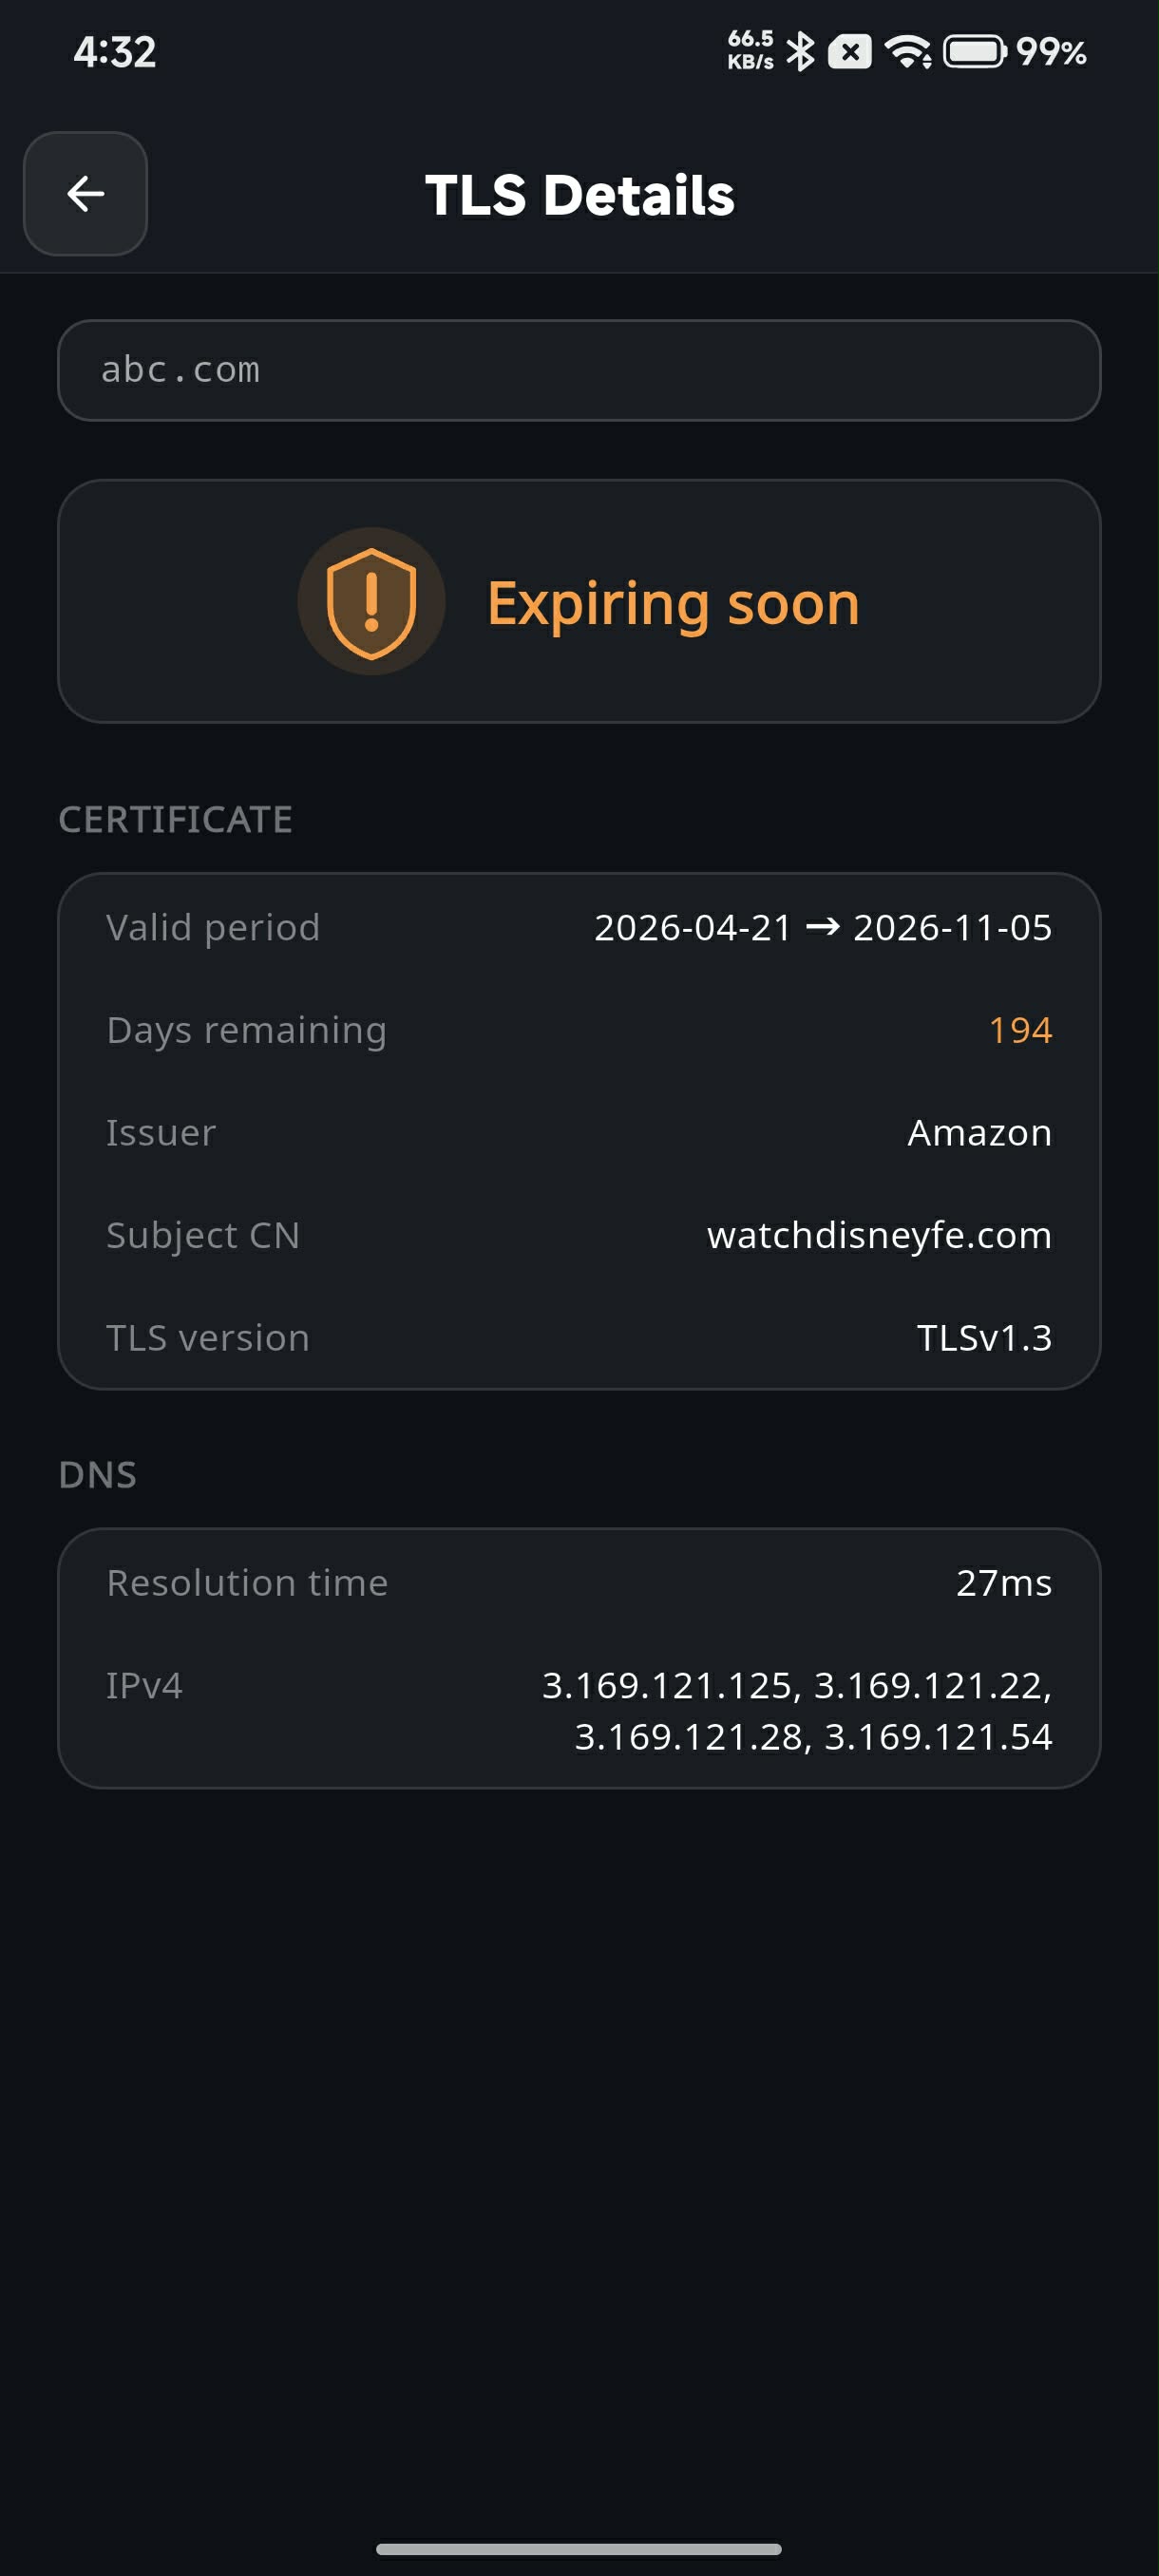
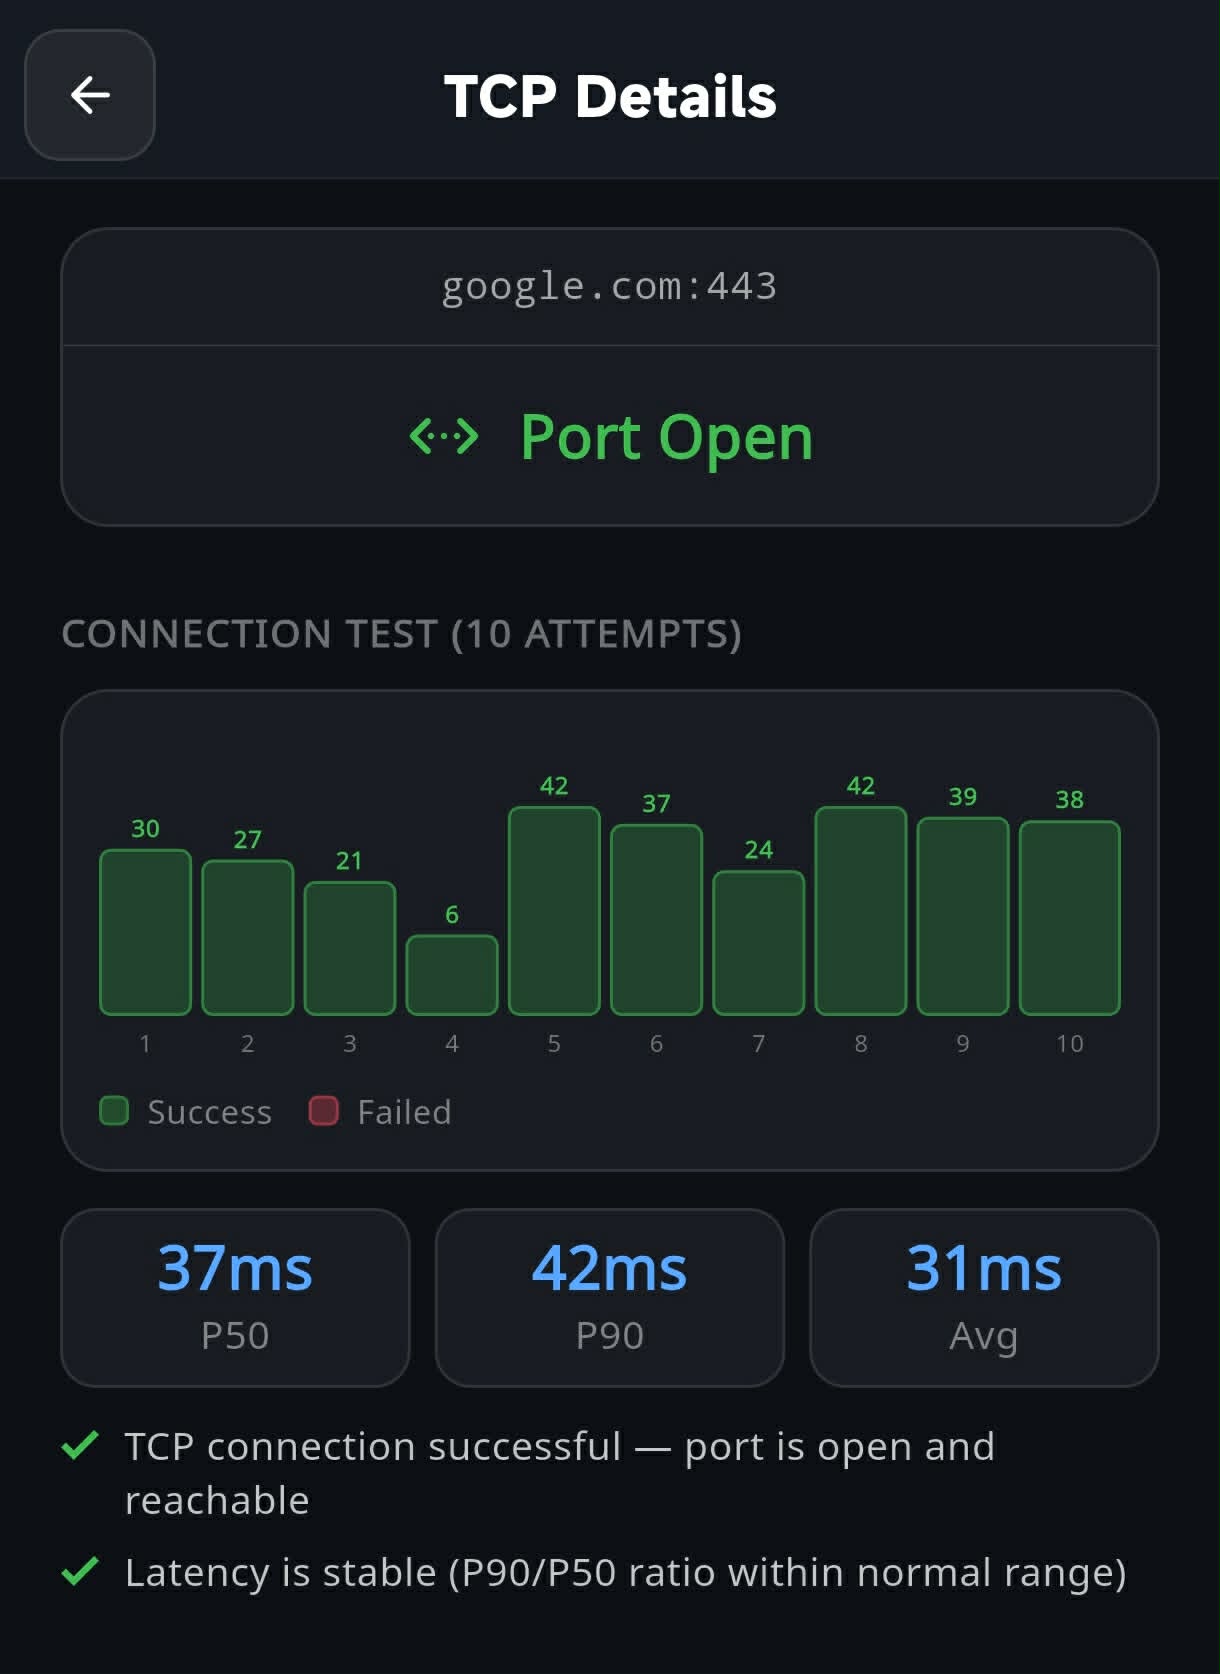
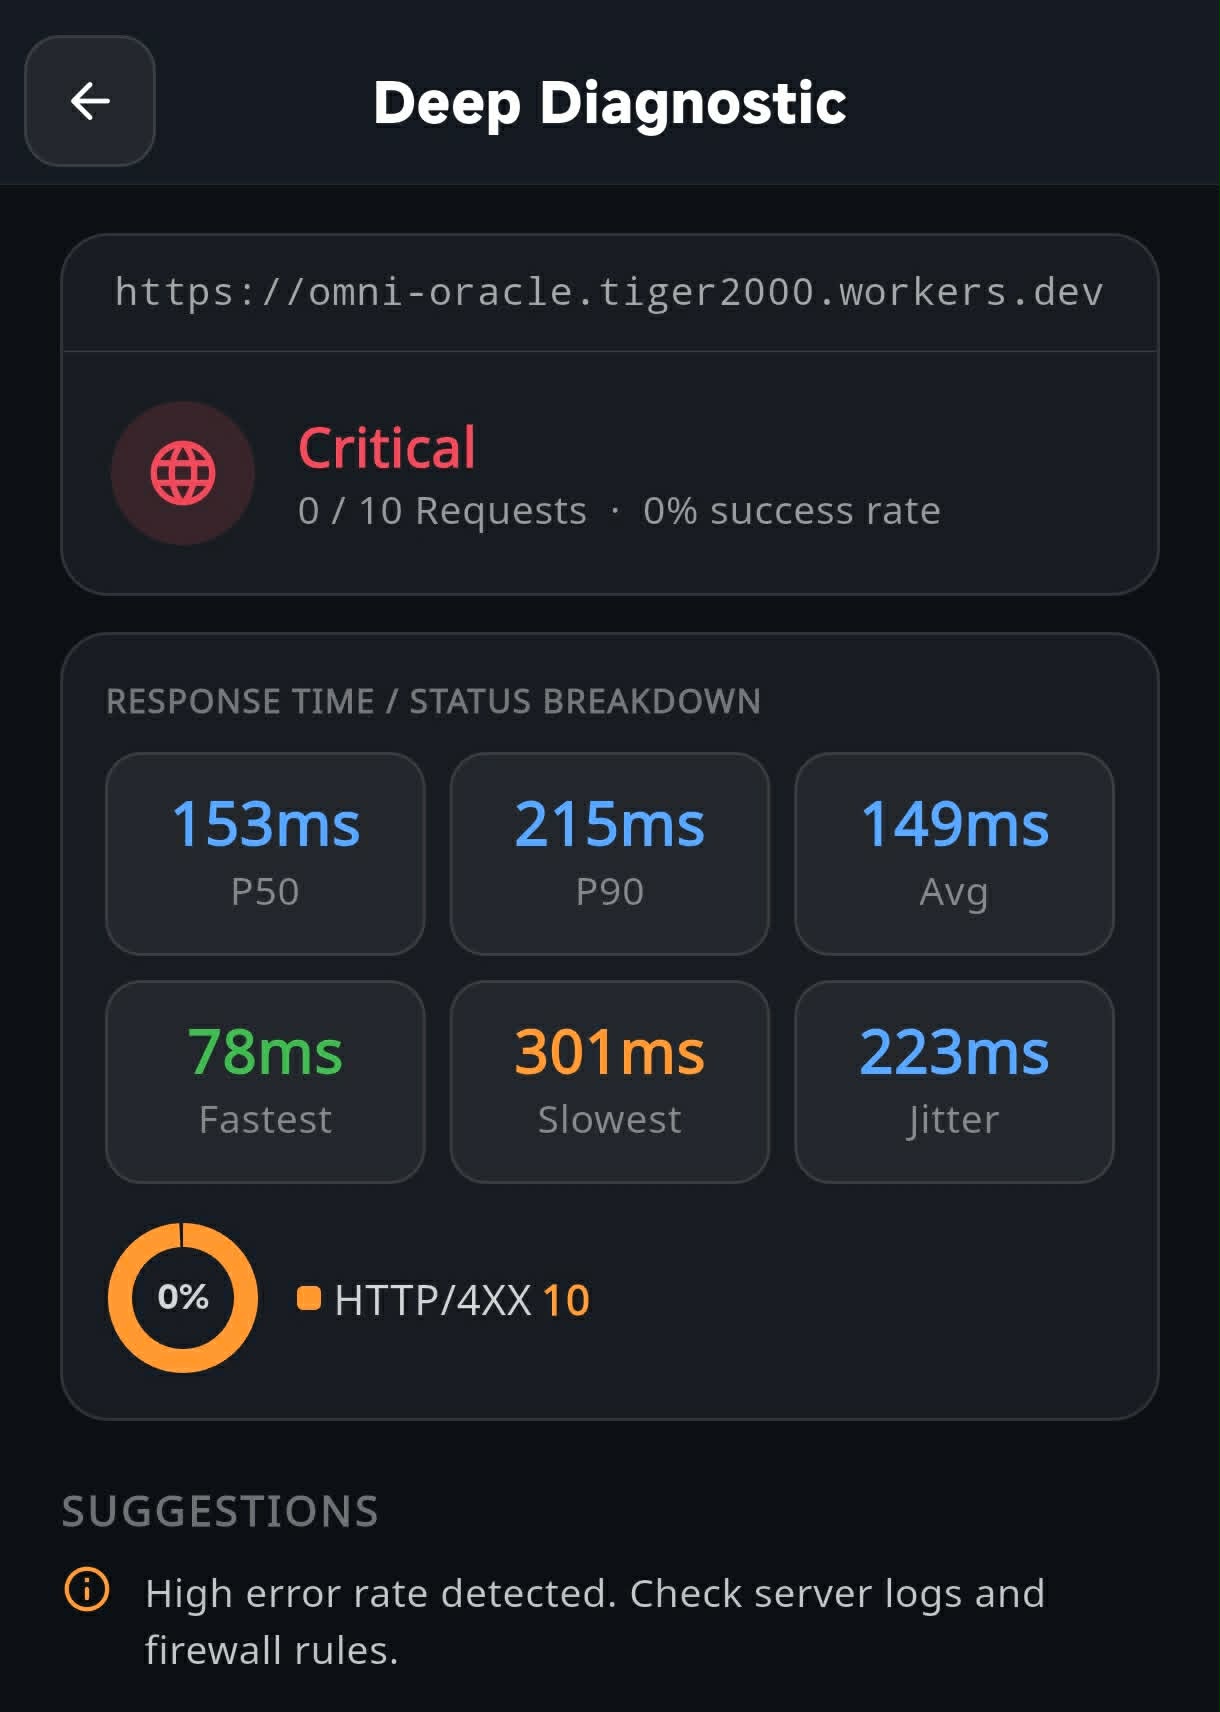
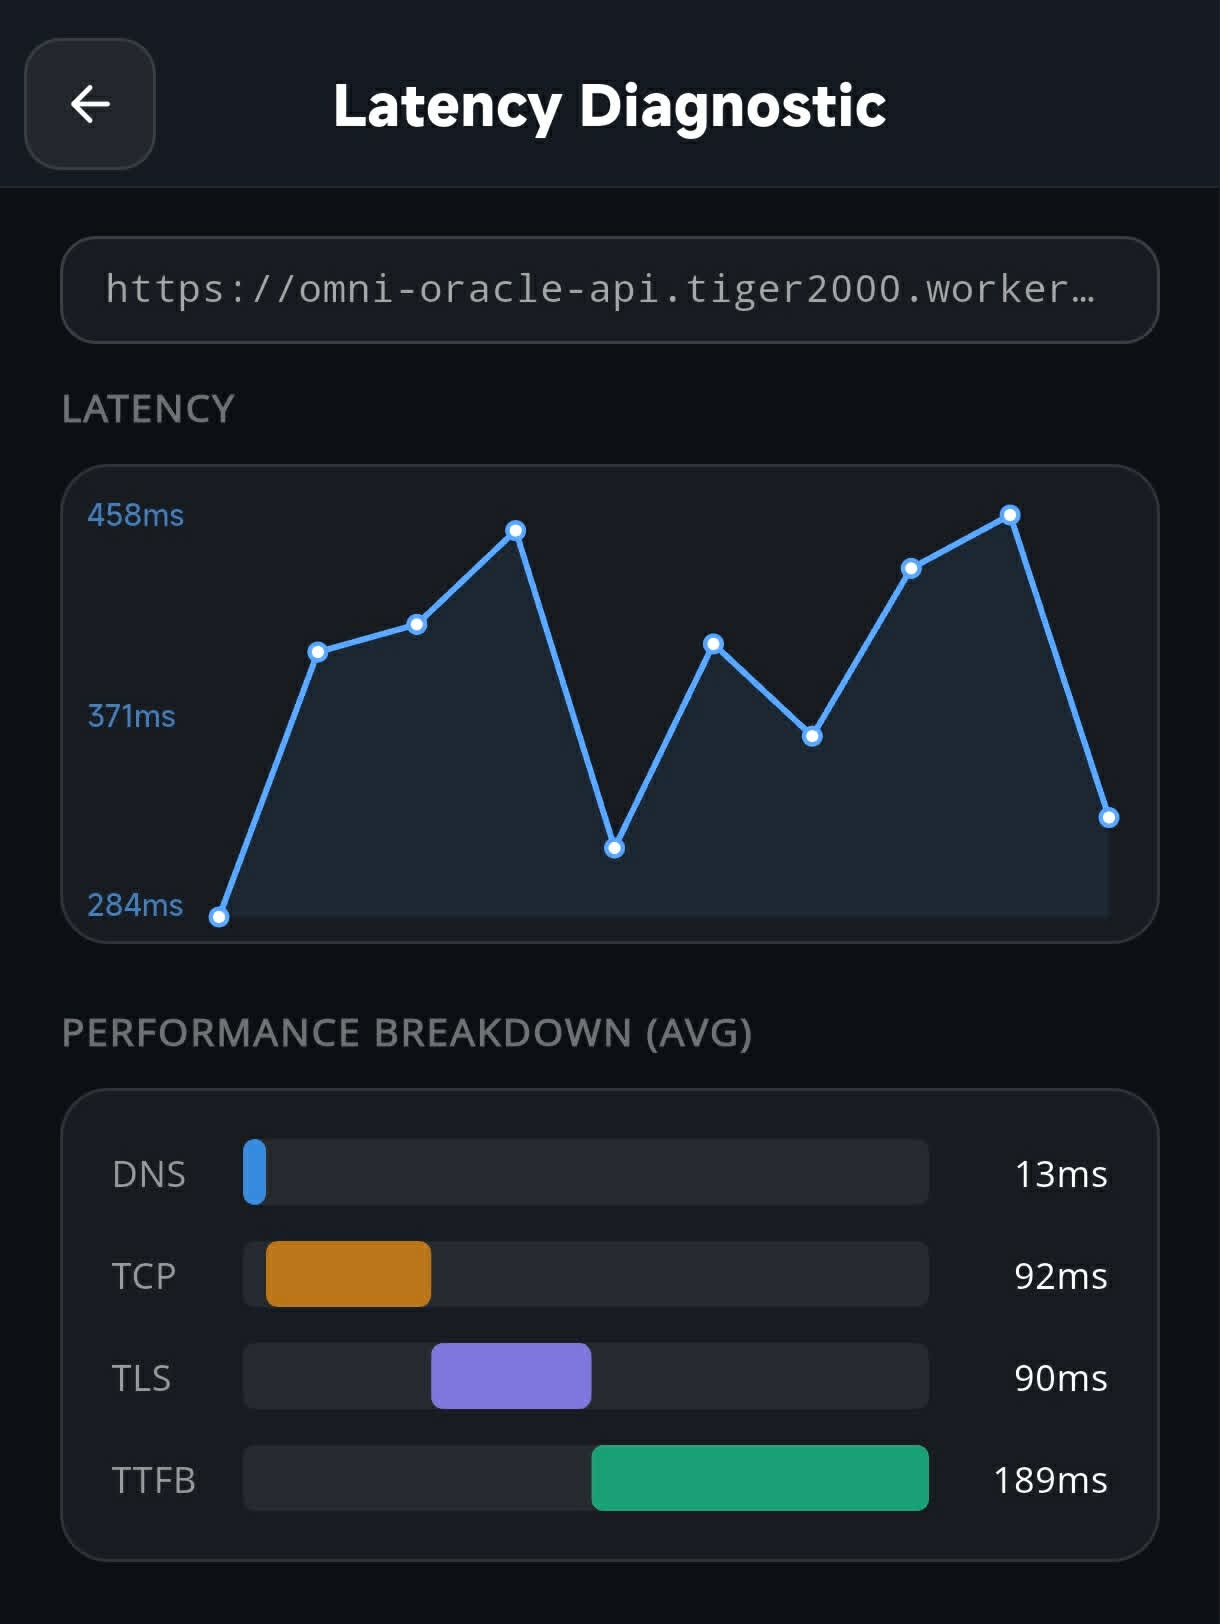
The dashboard shows each monitor category — TLS, TCP, Latency, and HTTP — with a count of how many are being monitored and how many have triggered an alert.
Color-coded status indicators (🟢 green, 🟡 amber, 🔴 red) let you immediately spot any issues across your infrastructure.
Track the expiry of your SSL/TLS certificates and get warned before they cause an outage.
Tap into any TLS monitor to see the full certificate details — valid period, days remaining, issuer, Subject CN, TLS version, and DNS resolution info.
An Expiring soon status (amber) warns you before the certificate actually expires, giving you time to renew.
Check if a host and port are reachable. Useful for verifying that your services are actually accepting connections.
OpsMon runs 10 connection attempts and shows you the result of each one — green for success, red for failure — along with P50, P90, and average latency.
Actionable suggestions at the bottom tell you what the results mean, so you don't need to interpret the numbers yourself.
Monitor your HTTP endpoints for non-2xx status codes and detailed response time breakdowns.
The deep diagnostic view shows P50, P90, average, fastest, slowest, and jitter response times across 10 requests — giving you a clear picture of your endpoint's health.
Status code breakdown (2XX, 4XX, 5XX) is shown with a progress bar, so you can quickly see the success rate.
Measure and break down response times across all connection phases — DNS, TCP, TLS, and TTFB.
The latency diagnostic breaks down each request into its component phases — DNS resolution, TCP handshake, TLS negotiation, and Time to First Byte (TTFB) — visualized as a stacked bar chart.
This makes it easy to pinpoint exactly where slowdowns are happening, whether it's DNS, your server, or the network.
OpsMon is built with privacy at its core. Everything runs on your device.
OpsMon does not collect or store any of your monitoring data — your servers, endpoints, and credentials never leave your device. Ad serving is provided by Google AdMob, which may collect device information for advertising purposes in accordance with Google's privacy policy.